Subsystems
GitOps and policy
Turns a claim into real resources, after the org's rules have said yes.
- Crossplane v2
- ArgoCD
- Kyverno
- CEL
- Terraform
- A developer asks for a standard Postgres and never names an instance class, backup retention or network placement. Those are platform defaults, with a custom tier as the escape hatch.
- Rules are fail-closed validating policies at admission. A denied claim leaves nothing on the cluster and a POLICY_DENY row in the audit log.
- ArgoCD heals drift on anything stateless and only flags it on anything stateful, so a live database is never reverted without a human.
In the validation week
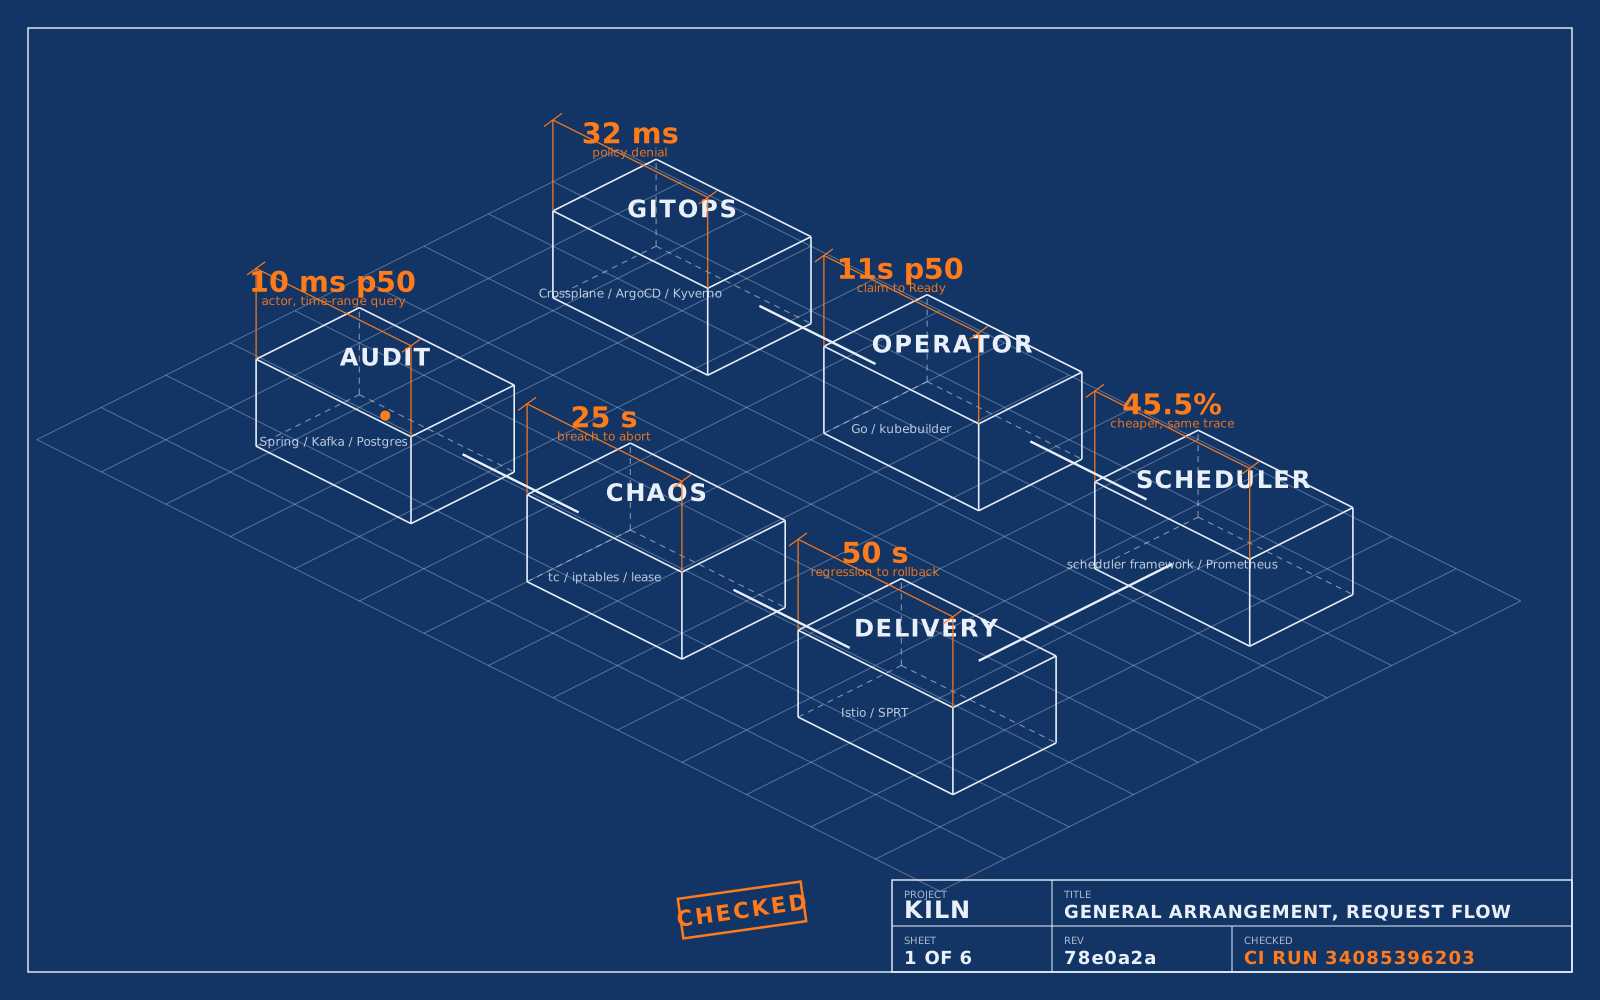
32 ms
to deny a claim over the storage ceiling. Nothing reached the cluster.
Settled by
Decision record 0006DatabaseClaim and the rule that denied one
apiVersion: platform.internal/v1alpha1kind: DatabaseClaimmetadata: name: checkout-db namespace: team-checkoutspec: parameters: tier: standard # standard | custom storageGB: 500 # the validation week's injected violation tags: team: checkout costCenter: eng-platform# gitops/policies/databaseclaim-org-rules.yaml- expression: object.spec.parameters.storageGB <= 100 message: "POLICY_DENIED rule=storage-ceiling: spec.parameters.storageGB must be at most 100"
Mechanisms
Test sheet: break the audit chain
Every row's hash covers its content and the previous row's hash. Change a field and the row fails verification. Rewrite its stored hash too, the way a careful intruder would, and the next row fails instead.
Edit any actor or outcome. Every hash is recomputed here, with the service's rule.
- prev
…stored…recomputed… - prev
…stored…recomputed… - prev
…stored…recomputed… - prev
…stored…recomputed… - prev
…stored…recomputed…
GET /v1/audit/verify
computing…
Calc sheet: score a placement
50 × cost + 30 × fragmentation + 20 × preemption, on four nodes carrying the placement contract. A latency-sensitive pod never sees the spot nodes: they are filtered before scoring runs.
kiln.platform.internal/workload-class
cpu request 1.0
- worker-aon-demand, $0.096/h, 1.2/4 cpu50 × cost1.0030 × fragmentation0.5520 × preemption1.00
86.5
- worker-bspot, $0.037/h, 0.4/4 cpu, risk 0.05
filtered before scoring: workload-class filter
- worker-con-demand, $0.170/h, 5.6/8 cpu50 × cost0.0030 × fragmentation0.8220 × preemption1.00
44.8
- worker-dspot, $0.065/h, 4.4/8 cpu, risk 0.12
filtered before scoring: workload-class filter
the SCHEDULE event this placement publishes
{"action":"SCHEDULE","details":{"outcome":"Bound","node":"worker-a","workloadClass":"latency-sensitive"}}Plan: cap the blast radius
The agent floors the percentage to whole pods from its own read of the cluster, and rejects a cap that floors to zero rather than rounding up. Faulted pods are hatched, as a section cut would be.
pods matching app=checkout-service: 7
maxReplicaPercentage: 30
floor(7 × 30%) = 2 pods faulted, deterministically, from the agent's own read of the cluster. The other 5 keep serving.
Injected failures
Oversized claim
500 GB against a 100 GB ceiling. Denied at admission; the claim never reached the cluster.
Bad deploy
A version answering 30% of requests with 500. Rolled back on the mesh, measured from the first traffic split.
SLO breach under chaos
A full network partition against a 20% error bound. Aborted, and the iptables rule was gone from the node one second later.
Invariants
Org rules are fail-closed Kyverno policies evaluated at admission, before anything is provisioned.
Decision record 0006Every resource the operator creates carries an owner reference to its custom resource, so nothing outlives it.
Decision record 0004The chaos agent re-derives the blast radius from its own cluster read, and a fault reverts on a lease dead-man switch if the controller disappears.
Decision record 0015A resilience score is SLO headroom plus recovery, reported only for a fault confirmed to have landed. A run that tested nothing never reads as a pass.
Decision record 0016Audit publishing never blocks a reconcile. A Kafka outage stalls no provisioning, rollout or revert, and a dropped publish is counted, not lost.
Decision record 0017The audit service alone computes the hash chain, under a single write credential no other subsystem holds.
Decision record 0018The operator holds create-only access to secrets.
Decision record 0019
The platform does not know, and does not need to know, whether a person or an AI agent submitted the request. An agent gets the same JSON contract, the same bearer token, the same policy gate before anything is provisioned and the same hash-chained audit row as a developer at a keyboard. That is what makes agent-submitted infrastructure safe to allow: the guardrails are in the structure of the platform, not in the judgement of the requester.
Validation
| Request type | Baseline (status quo) | p50 | p95 | n | Error rate | Guardrail |
|---|---|---|---|---|---|---|
| Provisioning (standard Postgres) | Manual Terraform PR with human review: hours to a day before merge and apply. | 11s | 16s | 10 | 0.0% (0/10) | |
| Scaling (storage growth) | Manual Terraform PR with human review: hours to a day before merge and apply. | 49 ms | 140 ms | 20 | 0.0% (0/20) | |
| Healthy deploy (canary promoted) | Manual on-call detection of a bad deploy (minutes to tens of minutes), manual rollback. | 2m14s | 2m30s | 29 | 0.0% (0/29) | |
| Bad deploy (injected regression) | Manual on-call detection of a bad deploy (minutes to tens of minutes), manual rollback. | 50s | 50s | 1 | 0.0% (0/1) | auto-rollback fired 1/1 |
| Chaos test (pod-kill, completed) | Zero pre-production resilience coverage; failure modes discovered during real incidents. | 46s | 52s | 19 | 0.0% (0/19) | |
| Chaos test (injected SLO breach) | Zero pre-production resilience coverage; failure modes discovered during real incidents. | 25s | 25s | 1 | 0.0% (0/1) | auto-abort, fault removed on the node fired 1/1 |
| Policy violation (storage over the ceiling) | Manual Terraform PR with human review: hours to a day before merge and apply. | 32 ms | 32 ms | 1 | 0.0% (0/1) | policy denial fired 1/1 |
| Audit query (actor, time range) | Manual compliance log reconstruction across disparate systems, commonly a multi-day effort at audit time. | 10 ms | 108 ms | 10 | 0.0% (0/10) |
201 audit rows in 23m13s of wall clock, 176 events acknowledged by Kafka, 0 publish failures, chain intact. Run 34085396203 on commit 78e0a2a.
Second pass
Calc sheet: the scheduler on a public workload
The first 93.5 minutes of the Google 2011 cluster trace: 12,477 machines, 57,012 placements, synthetic spot labels on half the machines. Once through the plugin's scoring function as a model, once through kube-scheduler itself on an envtest API server, with the default profile and the kiln profile as the config declares them. An empty cluster, so every idle machine can be released.
| Placement | Billed $, model / binary | vs default, model / binary | Latency-class on spot, model / binary | Machines touched, model / binary |
|---|---|---|---|---|
| default profile | 723.06 / 713.29 | 249 / 257 | 12,403 / 12,466 | |
| kiln profile | 59.56 / 65.51 | -91.8% / -90.8% | 0 / 0 | 2,104 / 2,253 |
The binary agrees with the model on the bill to within a few percent and on the class guarantee exactly. On the cluster as the trace found it, already 92.3% requested and carrying 132,982 tasks, the model bills $1329.75 for both profiles: no machine ever empties, so placement alone saves nothing. What holds in both scenarios is the guarantee, 0 production-priority tasks on reclaimable capacity against 263 for an economics-blind placement. The binary did not finish the full cluster, so that row stands as the model's only; the full tables say so.
Test sheet: the canary decision against two other rules
The sequential test at its defaults, a consecutive-breach threshold (the shape Flagger and Argo Rollouts ship) and a multi-window burn-rate alert (the shape the SRE Workbook gives), on the same seeded traffic, the alternatives tuned to the same false-rollback ceiling. Each cell is detection from onset, p50 / p95, and the share of regressions that promoted anyway.
| Detector | Worst false rollback | Step to 30% | Step to 2x the limit | Ramp over 8 windows | Latency tail |
|---|---|---|---|---|---|
| sequential test + CUSUM (this controller)ADR-0014 defaults | 2.8% | 30s / 30s, 0.0% | 1m15s / 2m30s, 0.0% | 1m45s / 2m0s, 0.0% | 30s / 45s, 0.0% |
| threshold, N consecutive breacheslimit x1.5, 4 consecutive | 2.0% | 45s / 45s, 0.0% | 1m15s / 2m45s, 6.6% | 1m45s / 2m30s, 0.0% | 45s / 45s, 0.0% |
| multi-window multi-burn-rateburn x1.25 (18.0/7.5/1.2) | 1.8% | 15s / 15s, 0.0% | 3m0s / 3m0s, 2.0% | 3m0s / 3m0s, 0.0% | 3m0s / 3m0s, 0.0% |
Then 21 traffic classes, 12 of them new, split in two: each alternative tuned on one half and scored on the other, the sequential test untuned. Where it loses:
99.3% false rollbacks at 5 rps, every one as Inconclusive. The 500-request sample gate outlasts the step deadline at that rate, and the controller does not derive either field from the traffic it sees. A spec mismatch, named as one.
7.5% false rollbacks on retry storms, against the 5% it promises. Correlated bursts break the independence the likelihood ratio assumes.
27.9% of heavy-tailed regressions missed, against the 10% it promises. The burn-rate alert misses 42.4% and the threshold 97%: everyone loses on that traffic, the sequential test least.
15 s against 30 s on a flagrant step, the burn-rate alert's win, one window against the three the evidence cap needs.
Every tuning point, with intervals, and the trade-off plot: held-out evaluation.
Load sheet: a thousand rollouts at once
N concurrent CanaryRollouts through the reconciler on an envtest API server. As shipped, the manager had controller-runtime's default client budget, 20 requests per second with a burst of 30, and one worker, because nothing had set either. The fix is three flags: the client budget and the reconcile concurrency.
| Rollouts | Config | Every rollout promoted in | Promoted | Reconcile p50 / p99 | Analysis tick late, p50 / p99 / max | Controller writes/s |
|---|---|---|---|---|---|---|
| 500 | as shipped1 worker, 20/30 qps/burst | 9m21s | 500 of 500 | 98ms / 155ms | 35s / 35s / 36s | 33.8 |
| 1,000 | as shipped1 worker, 20/30 qps/burst | 12m39s, timed out | 0 of 1,000 | 100ms / 135ms | 85s / 85s / 86s | 33.3 |
| 500 | fixed8 workers, 100/200 qps/burst | 2m39s | 500 of 500 | 14ms / 122ms | 0s / 1s / 2s | 151.7 |
| 1,000 | fixed8 workers, 100/200 qps/burst | 3m58s | 1,000 of 1,000 | 81ms / 160ms | 5s / 10s / 10s | 193.2 |
Lateness in a canary controller is risk: a regression that should roll back in 30 s rolls back while the queue drains. The fix moves the wall rather than removing it; at a thousand rollouts the status patches alone reach the new budget. Next in line, measured: one live read of the VirtualService per reconcile, because unstructured reads bypass the cache, and Events at a quarter of the budget. Per-verb request rates.
Revision note: the proof that never ran
The durable-outbox proof kills every controller, repeatedly and without grace, through a burst of requests, and requires each transition to land exactly one audit row with the chain intact.
It failed on every nightly for 29 days after it was pushed, on a precondition the harness asserted instead of waiting for, and nothing alerted. An audit of every claimed number found the streak, the harness now waits for its own precondition, a red nightly opens an issue, and the proof passed in run 38176386056 on 2026-10-11. The postmortem is blameless and names its action items; the audit itself and the second pass are methods in TESTING.md.